Flags Over Expected
Drive-extending defensive flags on 3rd and 4th down vs. the number expected from each offense's mix of downs and distances · 2018 through Week 3, 2026 (incl. playoffs)
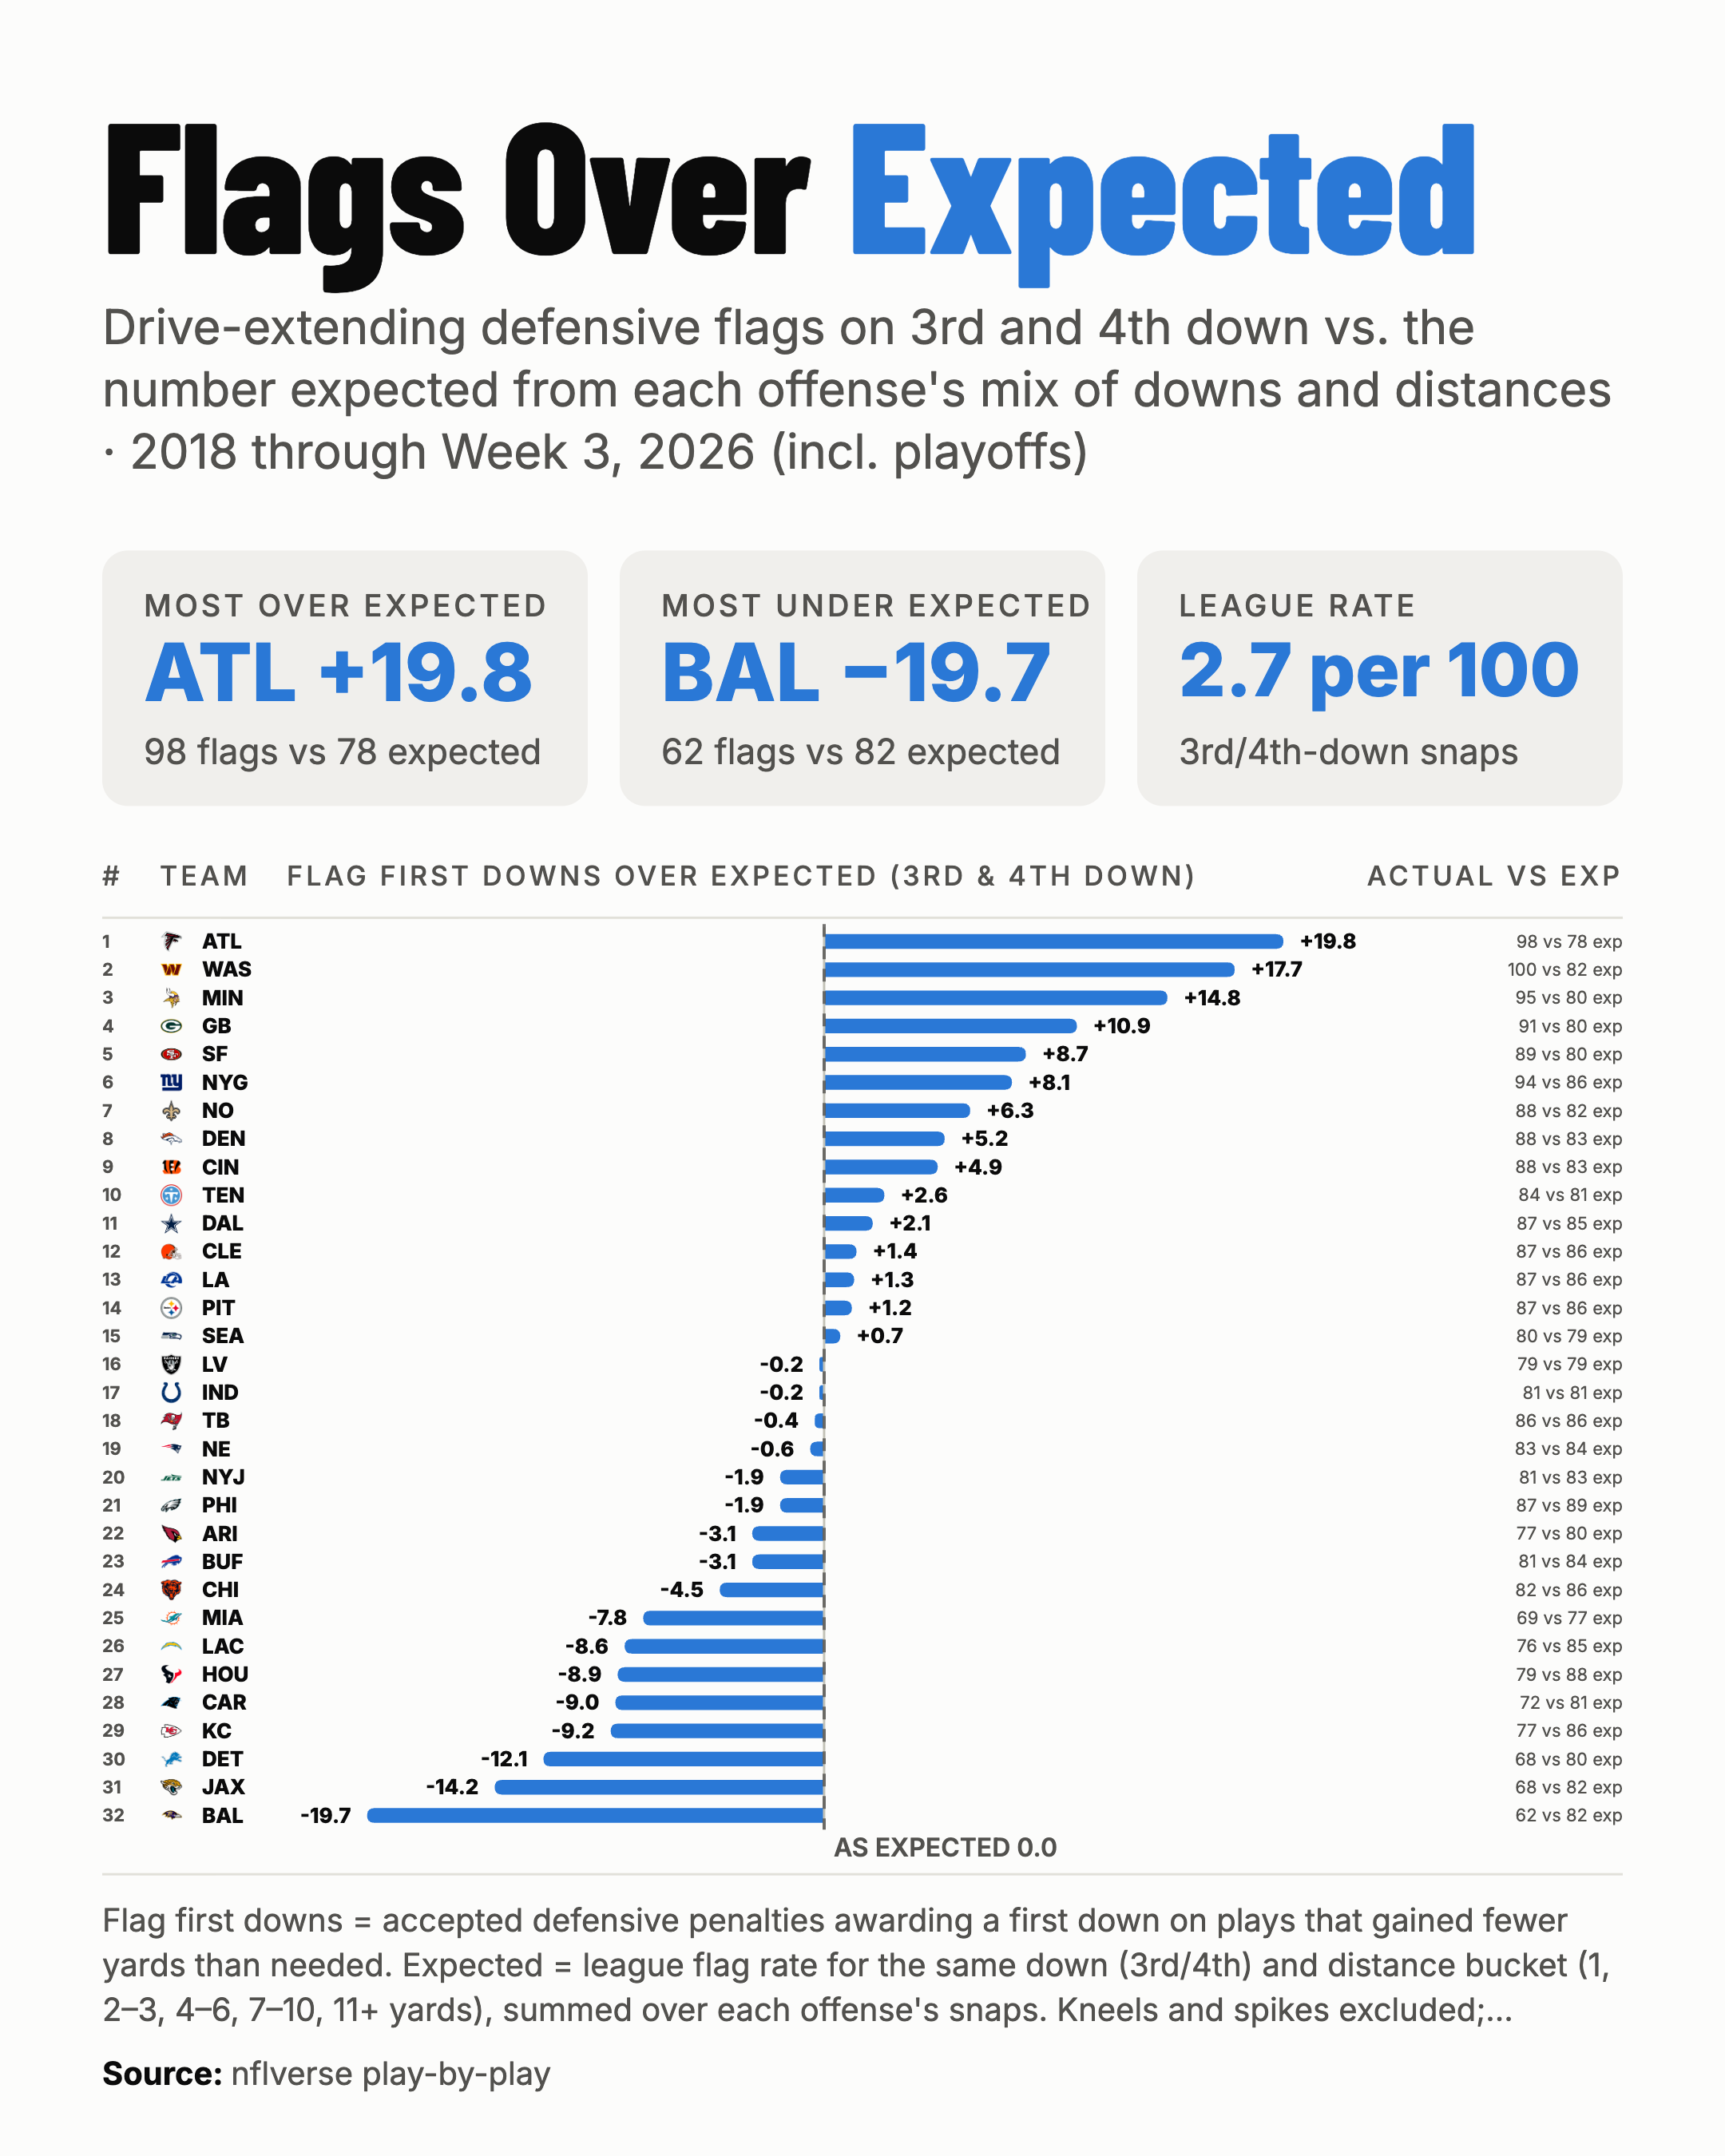
Adjusting for how many 3rd and 4th downs each offense faced, and at what distance, changes little. The adjusted order almost mirrors the raw rate: Atlanta (+19.8, 98 flags vs 78 expected), Washington and Minnesota draw the most drive-saving flags, and Baltimore draws the fewest (−19.7, 62 vs 82). KC is 28th at −9.2 (77 vs 86), so the original graphic's finding still holds.
Flag first downs = accepted defensive penalties awarding a first down on plays that gained fewer yards than needed. Expected = league flag rate for the same down (3rd/4th) and distance bucket (1, 2–3, 4–6, 7–10, 11+ yards), summed over each offense's snaps. Kneels and spikes excluded; wiped-out plays (no_play) included.
Source: nflverse play-by-play. Data from nflverse (CC BY 4.0). Made with NFL Charts · 2026-09-30
How this was calculated (SQL)
WITH p AS (
  SELECT posteam_canon AS team, down,
    CASE WHEN ydstogo = 1 THEN '1' WHEN ydstogo <= 3 THEN '2-3' WHEN ydstogo <= 6 THEN '4-6'
         WHEN ydstogo <= 10 THEN '7-10' ELSE '11+' END AS dist,
    CASE WHEN first_down_penalty = 1 AND penalty = 1 AND penalty_team = defteam
          AND lower("desc") NOT LIKE '%declined%' AND lower("desc") NOT LIKE '%offsetting%'
          AND coalesce(first_down_rush,0)=0 AND coalesce(first_down_pass,0)=0 AND coalesce(yards_gained,0) < ydstogo
        THEN 1 ELSE 0 END AS flag
  FROM pbp_lite
  WHERE season >= 2018 AND posteam IS NOT NULL AND down IN (3,4) AND play_type IS NOT NULL
    AND coalesce(qb_kneel,0) = 0 AND coalesce(qb_spike,0) = 0
), lg AS (
  SELECT down, dist, avg(flag) AS exp_rate FROM p GROUP BY 1,2
), t AS (
  SELECT team, count(*) AS plays, sum(flag)::INT AS flags, sum(l.exp_rate) AS exp_flags,
         avg(CASE WHEN dist IN ('7-10','11+') THEN 1 ELSE 0 END) AS long_share
  FROM p JOIN lg l USING (down, dist) GROUP BY 1
)
SELECT team, plays, flags, round(exp_flags,1) AS exp_flags,
  round(flags - exp_flags, 1) AS flags_oe,
  round((flags - exp_flags) * 100.0 / plays, 2) AS oe_per100,
  round(flags * 100.0 / plays, 2) AS raw_per100,
  round(flags / exp_flags, 3) AS ratio,
  flags || ' vs ' || round(exp_flags,0)::INT || ' exp' AS act_exp,
  round(long_share, 3) AS long_share,
  rank() OVER (ORDER BY flags / exp_flags DESC) AS rk,
  rank() OVER (ORDER BY flags * 1.0 / plays DESC) AS raw_rk
FROM t ORDER BY ratio DESC